
Lead author: Justin Svenson
Co-authors: Erik Bluvas, John McCaffrey, Adriana Pietras,
Anthony Portillo, Ali Saboowala, John Sines, Ruoyu Mi
The purpose of this chapter is twofold: to get more detailed accounts of the benefits of the NAS (NAS or the Supergrid) and to analyze financing mechanisms for construction.
We project numerous economic benefits to building the Supergrid:
- Since the data for the MacDonald publication was gathered in 2009, the price of energy generation, particularly from solar and wind (onshore and offshore), have dramatically decreased, making the NAS even more advantageous than previously projected.
- We project the price of the infrastructure to be $303 billion and $442 billion. Yet, the savings in electricity generation (the cost of generating electricity from wind and solar sources is much less than traditional sources) offset the cost of building the supergrid under most reasonable scenarios of the price of undergrounding transmission lines and the price of natural gas. Therefore, the total annualized cost of generating and transmitting electricity would be likely be lower because of the NAS.
- We estimated that between 649,010 to 936,111 constant jobs would be needed for construction of the transmission and generation capacity over a 30-year build time.
We analyzed financing options and make conjectures as to how the Supergrid would be financed in each region of the country accounting for projected cost and precedent of how other transmission projects were financed in each region. We do not recommend new taxes or government sponsored financing programs to build the Supergrid.
Private financing would fund most of the lines in a majority of regions. We also encourage participation from energy developers that stand to benefit from the Supergrid. Further, the Rural Utilities Services could make loan capital available to developers for the less lucrative lines that may be less attractive to private financiers.
In addition, these financing mechanisms could be used:
- Public-Private Partnerships.
- U.S. Department of Energy (DOE) loan guarantee programs.
- State clean energy funds.
- Private activity bonds.
- Federal infrastructure spending.
To make the NAS more attractive to investors, policymakers must make progress in several areas of development:
- Secure backing of federal/state governments, DOE, regional transmission organizations (RTOs)/ independent system operators (ISOs).
- Reduce permitting and regulation burden.
- Ensure stakeholder interests are aligned in each region.
- Encourage regional and national collaboration.
- Engage is thorough planning.
Economic research, methods, and results
Our objectves for this analysis were to explore in more detail the economic benefts of the proposed natonal overlay HVDC electric grid, and to develop a framework that could be used to conduct up-to-date economic beneft calculatons as new cost projectons associated with energy generaton and transmission technologies become available. This analysis provides a methodology to compute total project costs and create an updated line constructon cost estmate. We used the publicly accessible Jobs and Economic Development Impact (JEDI) models provided by the Natonal Renewable Energy Laboratory (NREL) to estmate the NAS’s effect on job creaton and regional economies at the natonal and state levels. Further, we used the results to conduct a more detailed analysis with higher resoluton data to estmate the economic impact of the NAS at state levels. The model includes a database of cost assumptons for varying types of transmission lines and power plants.
Cost Structure and Calculation
Due to major changes like unantcipated steep downward trends in costs of wind and solar energy generaton over the last several years, it became necessary to update the input cost assumptons of the NAS compared to those used in the MacDonald et al. (2016) study. We estmated the total capital cost for the transmission system by summing the Overnight Capital Cost (ONCC), new HVDC transmission cost, and variable natural gas costs. We compared the renewable generaton ONCC fgures from 2013 MacDonald et al. (2016) fgures were to 2018 Lazard Levelized Costs of Electricity fgures (referred to as LCOE or Lazard fgures).[1] The more recent study showed a dramatc decrease in ONCC for building various renewable generaton capacites. Such current LCOE is very close to the most optmistc MacDonald et al. (2016) estmates of future costs (projected for 2030, shown in Table 1), leading to an even more favorable forecast for the HVDC supergrid system.
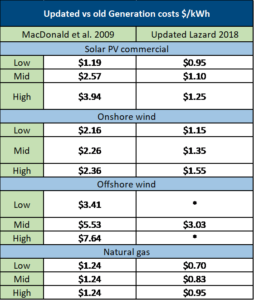
Table 1 Updated vs forecasted renewable generation costs. *Lazard (2018) did not include high- to low-end estimates of offshore wind generation costs
Next, the total transmission system cost was estmated. Transmission cost is a functon of Line Cost ($/MW-mile) and Staton Cost ($/MW). A line and staton cost comparison of MacDonald et al. (2016) fgures against JEDI Model fgures is shown below in Table 2. While the fgures for both categories were comparable, MacDonald et al. (2016) used data that indicated lower staton costs and higher line costs. Due to unforeseen favorable generatng costs, these diferences were mitgated, rendering the results very comparable.
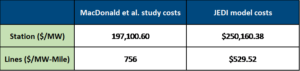
Table 2 Line and Station Cost Comparison
We then combined the MacDonald et al.(2016) system design with the results from the JEDI Model (i.e. front-end statons cost) and the updated cost fgures to arrive at a fnal comparison for the cost of the NAS system (both above and below ground) versus the system cost of the current AC grid. In the frst two scenarios, we used a simulaton of a single integrated system that could send electricity across the lower 48 states, as prescribed by the NAS. In the last scenario, we split the lower 48 states into district regions where energy generated in those boundaries must be used within the same boundaries (shown in Table 3). The single system was much more efcient since the scenario with the divisions requires natural gas to fll in the gaps that wind and energy cannot supply. Some regions, in the system divided into distnct regions, overproduced renewable energy while others underproduce renewable energy.
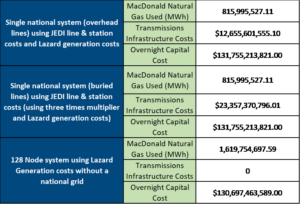
Table 3 Comparison of the NAS to current AC system cost. The calculation is based on assumption of the variable O&M cost of natural gas plants being $3.57/MWh and the heat rate being 6.43 MMBtu/MWh
Simulatons of the cost of generaton sources with and without the NAS were completed, where the new system favored only the least expensive forms of electricity generaton amongst ofshore wind, onshore wind, solar PV, and natural gas. Coal and oil were omited since they are more
expensive electricity generators in either scenario.[2] Our results showed that the onshore wind generaton capacity, which has gone down in price recently, will drive changes in nameplate capacity more than anything else under the NAS scenario. Costs would favor solar PV generaton and natural gas generaton much less, while ofshore wind energy generaton would remain stable.
As shown in Table 3.3, while NAS systems (both the overhead system and the underground system) require higher transmission infrastructure investment than the AC system, they need signifcantly less natural gas capacity in their energy portolio. The natural gas price is one of the key factors determining the cost-efectveness of the NAS systems comparing to the AC one. With natural gas plants’ variable operaton and management (O&M) cost being $3.57/ MWh and the heat rate being 6.43 MMBtu/ MWh, the total system cost can be presented as a linear functon of the natural gas price. And the graph below demonstrates the linear relaton.
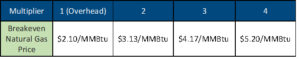
Table 4 Breakeven natural gas prices for system economic feasibility based on the underground system multpliers
When the natural gas price is low, the AC system can beneft from the low fuel cost as well as lower transmission infrastructure investments. However, with natural gas weightng high in its energy portolio, the fuel cost increases steeply with the increasing natural gas price. After reaching certain points, the NAS’s higher transmission infrastructure investments will be balanced by the saved fuel expenditure. For the overhead NAS system, the breakeven natural gas price is $2.10/MMBtu, which is lower than the market price in most scenarios. As long as the natural gas market price is higher than $2.10/MMBtu, the overhead NAS system will be cost efectve and can save money for customers. The underground NAS system, with higher investments in transmission lines, has a higher breakeven natural gas price at $4.17/MMBtu. Although the breakeven price of natural gas for an underground grid is higher than the current market rate for gas, the underground Supergrid would certainly provide more benefts than costs when considering the social cost of carbon emissions. Perhaps more importantly, as the underground NAS system is more secure against cybersecurity atacks, the extra transmission infrastructure investments could be viewed as an insurance premium protectng the country’s whole electricity system against potental emergencies. As such, the costs of undergrounding are small compared to the high risks of leaving the electrical grid system unprotected. Furthermore, the social cost of carbon emission, ranging from lower agriculture productvity and public health crisis to increased property damages due to extreme weather, is not at all neglectable. According to EPA, the Social Cost of CO2 is estmated to be more than $50 per metric ton CO2 by 2030 (with a discount rate of 3%). With NAS, providing a naton-wide integrated transmission system for clean energy resources, our society will be beter of from reduced carbon emission.
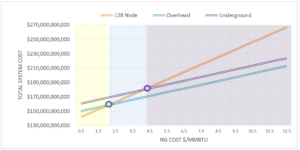
Figure 1 Breakeven natural gas price for overhead and underground HVDC systems
Sensitivity analysis – Natural Gas Impact
Since the usage of underground lines is not common enough to determine a commonly accepted multiplier, we performed a sensitivity analysis to find out how the breakeven point moves depending on both natural gas prices and the aforementioned multiplier. The results show that the breakeven comes at a higher price of natural gas as the multiplier increases. As mentioned before, the most likely scenario for the multiplier is approximately three, at which point the breakeven is $4.43/MMBtu. When the multiplier is two, the breakeven point of natural gas is well below $4.00/MMBtu. At a multiplier of four, the breakeven point is closer to $6.00/MMBtu. Long-term projections of the cost of natural gas are variable as many influences affect both the demand and supply of fuel costs. Expert analysts, however, predict that the cost of natural gas will be well over the 4.00/MMBtu threshold, meaning that at a three times multiplier, the NAS is projected to be economically viable in the long-term at the aggregate level.[3]
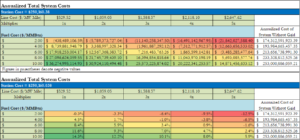
Table 5 Sensitivity Analysis to Cost of Natural Gas and Multiplier Effect for Undergrounding
Job Creation Estimation
Job creation values were estimated with data obtained from the NREL’s JEDI Model for transmission and generation. While these models are highly regarded, they do have limitations that should be noted before data interpretation:
- Does not project future and different values of LCOE, does not consider alternative investment avenues
- Transmission specific limitations and comments
- Must independently obtain transmission recovery rates that are crucial for Return on Investment (ROI) and Net Present Value (NPV) calculations
- Inter-state lines must be broken up into separate model runs and then recombined
- Lines transiting through rural/urban/etc. areas also require separate model runs
- Only one HVDC option: 500kV with overhead lines
- No capacity input, assumes 3GW
- Outputs from model runs using New Mexico as the state had anomalies
Table 5 shows the total projected costs of building the NAS. After consulting with multiple industry experts, a three times multiplier was agreed upon to estimate the costs of transmission lines per mile. JEDI figures were also used to determine the cost of converters and substations per mile with the estimation of total mileage of transmission cables needed to construct the NAS. No consideration was given to price impacts of technology adoption.
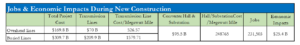
Table 6 CAPEX & Jobs & Economic Impacts During New Construction
Jobs created from installing transmission infrastructure are listed above, but only contribute a small amount of jobs compared to the jobs needed for the energy generation. Using the results from the NEWS model, developed by MacDonald et al. in the foundational paper, combined with the JEDI model, we calculated the job generation due to renewable energy infrastructure development (from transmission and generation) for each of the lower 48 states. After we combine the jobs estimates of all states with the jobs from installing the thousands of transmission facilities, we estimate that the NAS would produce the equivalent of 650,000 to 950,000 total constant jobs per year over 30 years.
Potential financing mechanisms
Private Financing
The majority of energy infrastructure projects are developed by private companies that secure financing from financial institutions, institutional investors, and the capital markets. Privately financed transmission projects typically have both a debt and equity component. Projects can be structured to have either corporate financing or project financing. Corporate financing uses existing funds from a company’s operating budget to fund a project which could use revenue from existing assets or funds from a corporate bond issue. In corporate financing, the lenders and investors have recourse to the entire corporation, not just the specific asset. Project financing involves the creation of a special purpose vehicle (SPV) whose only assets and debt are related to the specific project. In project financing, the lenders or investors only have recourse to the assets of the project.[4] Much of the NAS construction would likely involve project financing because it is conducive to multiple entities collaborating on a development.
Investment by private investors has been increasing as governments struggle to keep up with the demand for new infrastructure projects, including transmission projects. The International Energy Agency (IEA) projects $260 billion invested globally in new transmission and distribution lines through 2035.[5] There is private capital available in the market ready to invest in quality infrastructure projects. In the first half of 2016, it was estimated there was $75 billion of capital waiting to be invested in infrastructure.[6] The capital comes from insurance companies, pension funds, private equity, infrastructure funds, and sovereign wealth funds.
There are multiple reasons why investing in transmission lines can be attractive to investors. Cost recovery for transmission projects is regulated by the Federal Energy Regulatory Commission (FERC) creating an almost certain guaranteed rate of return. Cash flows from the project are typically stable and independent of energy prices or line utilization. Established transmission lines utilize proven technology and require minimal ongoing maintenance. Additionally, transmission investment is often resistant to competing investment along the same corridors. A competing investment would have difficulty obtaining financing unless there was significant load growth driving increased demand. These characteristics allow investors to accurately predict investment performance and help make transmission investment more attractive than other types of infrastructure.[7]
Debt Financing
Debt typically comprises 70-90% of infrastructure project financing. The primary forms of debt financing are through commercial banks, institutional private placements, and the corporate bond market. Traditional bank financing has long been a key component of infrastructure financing. Bank loans typically have lower interest rates than other types of debt financing. However, due to regulatory changes following the 2008 recession, banks are now required to secure long-term bonds to back longer-term loans and therefore banks prefer shorter loans (typically 7 years or less) due to the lower cost.[8] This can create refinancing risk for borrowers. Bank financing is most likely to be used in the early stages of planning and construction. After completion, bank loans are refinanced by a long-term security which has lower cost as much of the construction, permitting risk, etc. has been removed. Banks tend to be more flexible in the event of unforeseen events during construction and can negotiate loan restructuring or adjust the timeframe of disbursements.
Institutional private placements are another form of debt financing that can be arranged by an investment bank. Capital would be secured from select institutional clients through a negotiation process led by a bank acting in an agency capacity. The disclosure and paperwork required is similar to issuing a public bond, but there can be more room for flexibility when creating the contract. Insurance companies, pension funds, and sovereign wealth funds are types of investors that could participate in a private placement due to their need for long-term investments.
A third form of debt financing for transmission developers is the corporate bond market. Private companies can issue bonds to support general operations or specific projects and that money can be allocated to pay for development costs. Bonds are typically more common in the later operational stages of a project when the asset is producing a steady cash flow. Bonds can be a mechanism used when refinancing bank loans at the conclusion of the construction phase.
With all types of debt financing, the credit rating of the borrower is important to secure lower cost financing. Pension funds and insurance companies often have guidelines dictating the required credit quality of their investments. Transmission developers constructing the NAS will likely rely on multiple types of debt financing. Construction of many segments of the NAS will likely be financed by traditional bank loans. Once construction is completed, corporate bonds or private placements could be used to refinance the debt. This structure would align the risks and cash flows of the project with investor expectations for each type of debt. The types of debt ultimately used for each segment will be dependent on the developer that wins the contract and their preferred financing mechanisms.
Equity Financing
Debt holders usually require an infrastructure project to have an equity component to reduce risk and help protect debt holders from loss. Equity typically only comprises 10-30% of infrastructure financing. Equity holders take on the most risk in the project and therefore demand a higher return. Enlisting quality equity holders is often key to being able to secure debt financing at the lowest cost. Transmission developers often provide a portion of the equity in projects they construct. Aside from having a stake in the project, developers benefit from the tax savings of the depreciation generated. Additionally, private equity funds, insurance companies, infrastructure funds, and sovereign wealth funds can also be a source of equity.[9]
In the current low interest rate environment, long-term investors such as insurance companies and pension funds are eager to invest in infrastructure projects that offer a higher return than traditional investments. However, currently only 0.8% of the approximately $50 trillion in investable assets from insurance companies and pension funds are invested in infrastructure.[10] The lack of quality projects is the primary reason investment is not higher. Similarly, private equity funds are currently raising $30.5 billion for 43 new funds to invest in quality North American infrastructure projects in addition to the $68 billion in funds they hold, but have not yet invested.[11] This is evidence that there are willing investors looking for superior projects like the NAS to invest in. The key for the NAS will be securing the backing of stakeholders and making the project attractive to new investors.
Private financing will likely be the primary source of funds for constructing the NAS. It will be crucial to partner with transmission developers that have a wealth of experience in securing financing and successfully completing projects. The high cost of the NAS will necessitate using a variety of debt and equity financing mechanisms for each segment of the national grid.
Public-private partnerships
A new financing model has developed over the past two decades that could be used for some segments of the NAS. The Public-Private Partnership (PPP) model can take on many forms, but it involves the collaboration of government and private parties. The PPP model is particularly useful for projects where there is not sufficient private capital financing because it can use government investment to leverage additional private capital. It has become a popular model to finance transmission projects in emerging markets and is beginning to be used more in the United States. The main benefit to the PPP model is spreading risks associated with a large infrastructure project. It is important to structure the deal so that no one party takes on exorbitant amounts of risk. Spreading risk can attract investors that might not otherwise participate in a project. Private firms can provide project expertise and are often able to push projects along faster than the government. The PPP model works best when there is a stream of revenue to ensure an adequate return to investors.[12] FERC regulations allow each Regional Transmission Organization (RTO) and Independent System Operator (ISO) to use an allocation process to dictate how costs are recovered from ratepayers for transmission developments creating a steady revenue stream once the project is complete.
There are some challenges in implementing the PPP model for transmission projects. As of January 2017, only 37 states have legislation that allow public-private partnerships.[13] This could prevent using this model for some segments that cross multiple states if not all states allow public-private partnerships. The high regulatory burden of developing transmission projects can slow the process and discourage private investors from joining into a partnership. Projects financed with this model often work best if they have a political champion (governor, senator, etc.) helping to build support for the project. They can also help the project navigate the various federal and state agencies during the permitting process.
Historically, the PPP model has been used in the United States for transportation infrastructure projects. But there are some examples of transmission projects using a PPP financing model. The Path 15 project used a public-private partnership structure to finance and build an 83-mile transmission line connecting northern and southern California, helping to eliminate a bottleneck in the grid system. The Western Area Power Administration built and operates the line. The private company Trans-Elect assembled a majority of the project financing. In return, they were granted long-term transmission rights that will help them pay off banks and investors. As a high priority project in California, federal and state agencies expedited environmental studies and the project permitting process.[14] This was one of the first successful PPP projects for a transmission line and it shows the cooperation involved between governments and public and private companies.
The PPP model will be used for segments of the NAS that are less lucrative and do not have as much private financing available. As with all segments of the grid, collaboration and support from federal and local governments will be important to successfully structuring PPP deals that are beneficial to all parties. This financing model will be a vital mechanism to construct the less lucrative segments allowing the entire national grid to be completed.
Federal Government Infrastructure Spending
Traditionally transmission projects have been privately financed with little assistance from the federal government. However, infrastructure spending has come to the forefront of the national discussion so it is worth examining how a potential infrastructure spending bill at the federal level may impact the NAS. As of July 2017, no infrastructure bill has been proposed in either house of Congress, and it is likely they will focus on other issues before infrastructure. However, the presidential administration has released a framework for what their proposed policy might look like. Their policy would reduce regulations and the time needed to receive federal permits. They also propose using government investment to leverage private sector investment. This could indicate public-private partnerships will be much more common in the future. The policy also hopes to focus federal infrastructure investment on transformative projects that change the way infrastructure is designed, built, and maintained.[15]
Many of the proposals from the presidential administration could benefit the NAS. Fewer regulations and a shorter permitting time would help expedite the project and help attract private investment. The NAS could qualify as a transformative project since it is different from the structure of the current electrical grid and promises to have both environmental and national security benefits. Lower direct federal investment in infrastructure likely means the NAS would have trouble securing federal money for construction. Nonetheless, a PPP model used for some segments of the grid could receive federal money to leverage private investment.
The uncertainty regarding federal government support for infrastructure development will make private financing a crucial component of funding the NAS. However, there are some government programs available to supplement private financing for the less lucrative grid segments.
Department of Energy Loan Guarantee Program
The U.S. Department of Energy (DOE) issues loan guarantees to promote growth of new clean energy technology through the Loan Program Office (LPO). Title XVII of the Energy Policy Act of 2005 authorized the loan guarantees. The program applies to a wide range of technologies, including renewable energy and transmission projects. As of June 2017, there is up to $4.5 billion in funding available for projects in renewable and efficient energy. The NAS project appears to meet many of the criteria for acceptance into this program. Projects “that will have a catalytic effect on the commercial deployment of future Renewable Energy Projects” will be looked at favorably in the review process.[16] The NAS is likely to promote additional investment in wind and solar generation because more electricity will be able to be transported over long distances to population centers. The program specifies that for transmission projects to be considered efficient, they must lower electricity losses when compared to current commercial processes in the U.S. over an equivalent distance. The HVDC technology used in the NAS would limit losses of electricity through transmission, making the technology more efficient for long distance transmission.
However, there are factors that could limit the eligibility for the loan program for certain parts of the national grid. Projects that could be fully financed by commercial banks are viewed unfavorably in the review process. Projects that receive any other assistance from the federal government (grants, loans) may not be eligible. The loan guarantee program is designed to help new technologies prove their financial worthiness so that future investment can be financed by the capital markets. This program will most likely be useful for sections of the NAS that are projected to be less profitable and therefore need government assistance to secure financing. A section of the grid constructed early in the process may also have a better chance of acceptance into the program. Financial, technical, legal, and environmental factors are reviewed in the approval process along with a review of how well the project fits the policy of the program. The DOE is accepting applications through at least September 2019, although additional submission dates may be announced in the future.
The One Nevada Line is an example of the loan program being used for a transmission project. The project received a $343 million loan guarantee to finance a 235-mile 500 kV line through Nevada. The use of a new transmission tower design that has a smaller environmental impact was the technological innovation in this project. The new line is also expected to bring wind and solar generated power from Wyoming and Idaho into Nevada.[17] The NAS project has many of the same benefits as the One Nevada Line. This gives confidence to the idea that the loan guarantee program would be a possible financing mechanism for the NAS.
Additional Funding Sources
State Clean Energy Funds
More than 20 states have created Clean Energy Funds using state government funds as a way to promote growth in renewable energy.[18] While each state’s fund has their own design, these funds often are used to attract private investment to renewable energy projects. These funds have primarily been used to provide funding for individual renewable generation projects, but there may be potential to access state funding for the NAS because an improved transmission grid will drive private investment in renewable generation. These funds would likely not provide direct investment to build the NAS but would instead help attract and guarantee financing for private capital investors. This would involve collaboration between private investors, utility companies, and state government agencies.
Rural Utilities Service
The Rural Utilities Service is a program under the U.S. Department of Agriculture that provides needed infrastructure development and improvement to rural communities. The program provides direct loans, loan guarantees, and grants to electric projects in transmission, distribution, and generation. The loans are primarily made to state and local government entities and cooperative utilities, although for-profit companies are also eligible.[19] The program made $3.4 billion in loans and loan guarantees in 2015 and the amounts are expected to continue increasing. Most loans are between $20 million and $200 million. General guidelines indicate projects should benefit populations of 20,000 or fewer, although there is some flexibility.[20]
Segments of the NAS through rural areas or segments that would improve service to rural areas are likely to be eligible for financing through this program. While this program is not likely to be a large piece of grid financing, it could help secure funding for less lucrative segments in rural areas. This program can be used in partnership with other financing to help attract private investment. It would also provide a source of public investment in a public-private partnership.
Private Activity Bonds
A potential source of financing for private companies investing in transmission infrastructure are Private Activity Bonds (PABs). These bonds are federally tax exempt and therefore allow borrowing at a lower interest rate. They do require a private company to partner with a government agency that acts as the issuer of the bond. However, the private company pays the debt service on the bond under a contractual agreement. Section 142 of the IRS tax code allows PABs for surface transportation projects. [21] They have not been used for transmission projects in the past and it would take new legislation to allow PABs for electric developments. Allowing these types of bonds to be used for the NAS would incentivize private companies to invest in the project because borrowing would be cheaper for transmission projects using PABs than investing in other types of infrastructure.
Regional Overview
Historically, the energy sector in the United States had been dominated by vertically integrated organizations that owned and operated the generation, transmission, and distribution services within a geographic area. Beginning in 1978, deregulation allowed some utilities to create power pools to facilitate wholesale transactions over larger geographic areas. By the 1990’s there was a need to have open access to transmission services for all utility companies to create competition among generators. FERC issued orders to encourage the creation of regional organizations that would control the transmission of energy and allow open access to transmission lines.
Today there are six RTO or ISO regulated by FERC: ISO New England, New York ISO, PJM, Midcontinent ISO, Southwest Power Pool, and California ISO. The Electric Reliability Council of Texas is regulated by state regulators because it is located entirely in the state of Texas. Much of the southeastern and western United States are not currently covered by ISOs. In analyzing the financing options for the NAS, we look at a financing strategy for each ISO region. We will also look at the Southeast U.S. and Western U.S. as separate regions despite not having an organized ISO.
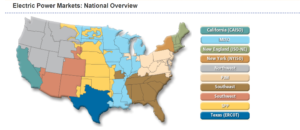
Source: Federal Energy Regulatory Commission[22]
One of the primary responsibilities of each RTO is managing the transmission planning process to ensure the grid continues to meet expected future electrical demand. We reviewed the planning process in each region because the NAS will first need to secure the support of RTOs through each individual planning process. We also look at recent regional transmission projects. We review the financing and project details for recent developments to help guide our recommendations for possible financing strategies in each region.
ISO New England
| Geographic Region | Transmission Miles | Generating Capacity | Proposed NAS Miles | Proposed NAS Cost |
| Connecticut, Maine, Massachusetts, New Hampshire, Rhode Island, Vermont | 9,000 | 30,500 MW | 1,167 | $7,927,385,532 |
Transmission Planning and Approval Process
The transmission planning process for ISO New England develops a regional plan for future system needs over a ten-year time horizon. The process begins by conducting a Needs Assessment to determine the grid’s adequacy. Where it is determined upgrades to the grid are necessary, either a Solutions Study or a Competitive Solution process will be undertaken to find the most economical upgrade project. A Competitive Solution process will be the most likely entry point for the NAS. In this process, project sponsors submit proposals for projects to address the identified need. Projects are then selected based on the cost, electrical performance, feasibility, and future system expandability.[23]
Recommended Financing Mechanism
The proposed routing through the New England region is the smallest segment of the NAS with an estimated cost of approximately $7.9 billion. The grid in this section will likely be privately financed. Every state in this region does have a Clean Energy Fund indicating there is government support for renewable energy projects. The Clean Energy Funds also open up the possibility of using state financing to help attract private investors. This funding could be used to leverage private investment through a public-private partnership. Vermont is the only state in the region that does not currently allow the PPP model.
New York ISO (NYISO)
| Geographic Region | Transmission Miles | Generating Capacity | Proposed NAS Miles | Proposed NAS Cost |
| New York | 11,124 | 38,576 MW | 1,267 | $8,607,906,983 |
Transmission Planning and Approval Process
NYISO engages in planning for reliability, economic, and public policy upgrades to the transmission grid. The reliability plan is a two-year process that assesses the needs over the next ten years. The economic planning process identifies areas of congestion in the grid and determines specific projects that have a positive benefit to cost ratio. The public policy planning identifies needs driven by new public policy requirements and solicits solutions from member firms.[24] Upgrading transmission infrastructure could be part of either the economic or public policy planning process and could solve congestion problems within the state’s grid identified in the economic planning studies. It could also help the state meet renewable energy goals and would be an appropriate public policy solution. Exceeding the benefit to cost expectations will be the greatest hurdle for the NAS to gain approval in New York.
Current and Proposed Projects
West Point Transmission
A proposed a 80-mile HVDC transmission line buried under the Hudson River provides insight into a financing model that could work for portions of the NAS. The $1 billion West Point Transmission project is very similar in structure to the NAS. The project was proposed as part of the state’s Energy Highway Blueprint in 2012 and is still in the development phase securing permitting. It is similar to two other completed projects by PowerBridge, Neptune and Hudson. The proposed financing plan includes equity financers Energy Investors Funds, Starwood Energy Group, and NRG Energy. Debt financing would also be secured from either commercial banks or institutional private placements. The developer would enter into a long-term transmission capacity purchase agreement to recover the costs of construction.[25]
Recommended Financing Mechanism
The NYISO has a history of supporting high voltage transmission projects similar to the NAS and there are development companies that have experience securing the private financing required. The estimated cost of the NAS in the NYISO is $8.6 billion. This cost is reasonable when compared to the $1 billion for the 80-mile West Point Transmission project. A national grid would help upstate New York connect with the large population center in New York City. This connection would allow renewable hydro electricity generated in the northern part of the state to benefit all rate payers in the region. The Energy Highway Blueprint approved in 2012 also shows there is support for transmission projects from the state government. The state’s regulatory bodies have approved similar projects in the past and should be receptive to new proposals as part of a national system. Due to the large population base and government support, it is likely that the NAS will be lucrative to private investment.
PJM Interconnection
| Geographic Region | Transmission Miles | Generating Capacity | Proposed NAS Miles | Proposed NAS Cost |
| Delaware, Illinois, Indiana, Kentucky, Maryland, New Jersey, North Carolina, Ohio, Pennsylvania, Virginia, Washington D.C., West Virginia | 82,540 | 176,560 MW | 5,265 | $35,755,649,493 |
Transmission Planning and Approval Process
PJM conducts an annual planning process resulting in the Regional Transmission Expansion Plan (RTEP). A 15-year time horizon allows the planning to look at how reliability upgrades and expansion will impact the grid in the future. The planning process includes input from all stakeholders as well as changes in public policy. The PJM board ultimately approves recommended system improvements and they are added to the RTEP. Since 1999, the board has approved $29.3 billion of transmission system improvements.[26]
Current and Proposed Projects
Susquehanna-Roseland Reliability Upgrade
A 150-mile 500 kV transmission line upgrade between Pennsylvania and New Jersey was completed in 2015. The $1.4 billion project was a joint venture between two public utility companies, PPL Electric Utilities and PSEG. PPL Electric built 101 miles of the line for $630 million and PSEG built 45 miles for $775 million. The project was intended to improve reliability and reduce congestion. This project was fast-tracked by the Obama administration allowing better coordination of government permitting. However, there was pushback from environmental groups because the line passed through federal park lands. State regulators approved the project in 2010, but the National Park Service did not approve the project until 2012.[27] Despite having backing from the presidential administration, the environmental concerns still caused a delay in permitting. The Susquehanna-Roseland project is an example of two public companies collaborating to complete a needed high voltage transmission expansion. Government support allowed the project to proceed more quickly and successfully satisfy all stakeholders, which illustrates the importance of gaining support from all public and private stakeholders.
Recommended Financing Mechanism
The NAS in the PJM region is likely to be privately financed. This segment of the grid goes through highly populated regions, and will therefore be lucrative to private investors. The estimated cost of the NAS in this region is approximately $35.7 billion. Each state in this region also has legislation allowing public-private partnerships. The Susquehanna-Roseland Reliability Upgrade shows how two companies can collaborate to complete a large scale project. Encouraging partnerships between public and private parties is a strategy that should be successful in this region.
Midcontinent ISO (MISO)
| Geographic Region | Transmission Miles[28] | Generating Capacity | Proposed NAS Miles | Proposed NAS Cost |
| Arkansas, Illinois, Indiana, Iowa, Kentucky, Louisiana, Michigan, Minnesota, Mississippi, Missouri, Montana, North Dakota, South Dakota, Texas, Wisconsin | 65,800 | 174,724 MW | 8,276 | $56,204,593,784 |
Transmission Planning and Approval Process
The MISO develops the MISO Transmission Expansion Plan (MTEP) annually. The plan addresses reliability of the grid as well as ensuring compliance with state and federal energy policy requirements. The planning process begins with stakeholders submitting proposed projects for review. MISO’s Board of Directors facilitates the evaluation of projects to determine if they are appropriate for inclusion in the MTEP. The 18-month planning process includes model building, reliability and economic analysis, and resource assessments. There are three types of projects included in the MTEP: Bottom-Up projects, Top-Down projects, and Externally Driven projects. The NAS would likely be considered an interregional Top-Down project because it would have a regional and national impact. These projects have costs shared among beneficiaries.[29]
Current and Proposed Projects
CapX2020
The CapX2020 is a series of five transmission expansion projects across North Dakota, South Dakota, Minnesota, and Wisconsin. The development of 345 kV and 230 kV lines spans 725 miles and will cost $2.1 billion. It is a joint initiative between 11 transmission-owning utilities in the states.[30] The project was designed to bring wind energy to population centers. Lack of transmission capability has been a roadblock to additional development of wind generation facilities in South Dakota and North Dakota. This project will not satisfy all the transmission needs of the region and more development will be necessary to reach the full potential of wind generation development.[31] This expansion illustrates the need for a robust transmission grid to ensure the growth of renewable energy generation, a problem the NAS will help solve.
Recommended Financing Mechanism
The CapX2020 development shows that companies in this region are willing to collaborate to build a transmission network to benefit the entire region. Most of the financing for that project and for the NAS will come from companies securing private financing. The estimate cost for the NAS in the Midcontinent ISO is $56.2 billion. This is one of the largest section of the NAS with over 8,000 miles of proposed transmission lines. There is potential in this region for collaborations between transmission developers and renewable energy developers. A lack of transmission capacity has delayed some wind energy projects, while transmission developers are hesitant to build transmission until generation plants are built. Partnerships between transmission and generation developers will ensure both get built and could attract investment to the NAS.
Southwest Power Pool (SPP)
| Geographic Region | Transmission Miles | Generating Capacity | Proposed NAS Miles | Proposed NAS Cost |
| Arkansas, Iowa, Kansas, Louisiana, Minnesota, Missouri, Montana, Nebraska, New Mexico, North Dakota, Oklahoma, South Dakota, Texas, Wyoming | 65,755 | 83,945 MW | 4,786 | $32,505,907,344 |
Transmission Planning and Approval Process
The Southwest Power Pool conducts an iterative three-year planning process that includes a 20-Year, 10-Year, and Near-Term Assessment in a process they call Integrated Transmission Planning (ITP). These reports identify transmission projects that are needed within both short and long-term time horizons while also identifying potential costs and benefits of each project. The Near-Term Assessment focuses on reliability issues within the grid at current usage levels. The 20-Year and 10-Year Assessments focus on identifying larger transmission projects to benefit the region using a number of different usage scenarios. These scenarios account for growing demand and potential changing regulations requiring more energy to come from renewable sources. The 20-Year Assessment is intended to create a transmission structure of high voltage (300 kV and above) lines that will be able to serve the region in the long-term.[32] Additionally, entities can request a Sponsored Upgrade or perform a high priority study in accordance with the region’s Open Access Transmission Tariff that can lead to a transmission project being approved. The NAS could either request a Sponsored Upgrade study or be included in one of the longer term assessments.
Current and Proposed Projects
The Midwest Transmission Project
The Midwest Transmission Project was a 180-mile 345 kV transmission line between Sibley, Missouri and Nebraska City, Nebraska completed in 2017. The development was a joint venture between Kansas City Power & Light and the Omaha Public Power District. The new line is an additional connection between the east and west sections of the RTO and aims to deliver more renewable energy to the eastern half of the region. The venture cost approximately $400 million and was financed by the participating companies. The project was one of SPP’s Priority Projects, so cost recovery will come from the entire region’s rate payers.[33]
Recommended Financing Mechanism
Financing in the SPP will likely be similar to MISO. Most of the NAS will be financed by private capital secured by the developing companies. Rural areas may be able to use loans from the Rural Utilities Service. The estimated cost for the NAS in the SPP is $32.5 billion. There is a lot of wind generation in this region so there is also the potential for collaboration with wind energy developers. Renewable energy developers in this region will benefit greatly from the NAS because the energy generated in the SPP will be transmitted to population centers outside of the region. This should entice private developers and government bodies to support the NAS to help drive economic development in these regions.
California ISO (CAISO)
| Geographic Region | Transmission Miles | Generating Capacity[34] | Proposed NAS Miles | Proposed NAS Cost |
| California, Nevada | 26,000 | 71,417 MW | 2,220 | $15,078,438,727 |
Transmission Planning and Approval Process
CAISO conducts an annual transmission planning assessment. The plan identifies reliability, public policy, and economic needs of the transmission grid. The reliability planning performs a 10-year analysis of grid performance during projected peak usage. The public policy planning cycle largely attempts to determine needed grid upgrades to meet the state’s renewable energy goal of 50% by 2030. Economic planning determines projects that would provide economic benefits to customers. The NAS could satisfy all three of the planning mechanisms by increasing reliability and reducing grid congestion lowering costs for customers. The grid also would help the state meet the renewable energy goal. The ISO also conducts “special studies” on issues impacted by transformational change in the way electricity is consumed.[35] It might make sense for the NAS to be part of a special study due to its wide ranging interregional impacts.
Recommended Financing Mechanism
California has one of the most ambitious renewable energy standards, requiring 50% of the state’s electricity to be supplied by renewable sources by 2030.[36] The state’s aggressive approach indicates there is government support for growing renewable energy production. The estimated cost of the NAS in the California ISO is approximately $15.1 billion. Because of the state’s high population, extensive renewable energy generation, and public policy support for renewable energy it is likely that private investment will be lucrative in California. The state also has legislation allowing public-private partnerships, which could be another avenue to attract private investors.
Electric Reliability Council of Texas (ERCOT)
| Geographic Region | Transmission Miles | Generating Capacity | Proposed NAS Miles | Proposed NAS Cost |
| Texas | 46,500 | 78,000 MW | 2,525 | $17,150,753,074 |
Transmission Planning and Approval Process
ERCOT develops a Regional Transmission Plan annually with their Regional Planning Group and Transmission Service Providers in the region. The plan assesses reliability and economic transmission grid needs within six years. The ISO also conducts a Long-Term System Assessment every two years. This assessment uses scenario analysis to determine the strength of existing projects when considering the long-term transmission needs of the region.[37] Stakeholders can submit projects for evaluation by the Regional Planning Group. A project will be included in the Regional Transmission Plan if the ERCOT Board of Directors determines the project would be a solution to identified grid needs.
Current and Proposed Projects
Texas Competitive Renewable Energy Zone
The Competitive Renewable Energy Zone (CREZ) is a $6.8 billion project born out of legislation from the Texas Legislature in 2005 that designated geographical areas for potential renewable energy generation. The Public Utility Commission of Texas established a transmission development plan and assigned construction of the proposed lines to transmission service providers. The total development had approximately 3,600 miles of 345 kV transmission lines connecting renewable resources in West Texas to population centers in the eastern part of the state. This project is an example of a government sponsored transmission project that was constructed, developed, and financed primarily by private companies. Because the initiative was backed by government entities there was more collaboration in permitting allowing efficient regulatory approval.[38]
Recommended Financing Mechanism
The ERCOT region is the most independent of all RTOs because it operates its own interconnection and most transmission lines are within the state. The independence has allowed them to complete projects, such as the CREZ, much more efficiently than other regions. Their state government has shown support for transmission projects similar to the NAS and there are transmission service providers with experience in developing and financing transmission lines. The estimated cost of the NAS in the ERCOT region is $17.1 billion. The cost would likely be financed by private capital. A wealth of renewable wind and solar resources in the western part of the state and large population centers in the eastern part of the state make transmission projects lucrative to private investment.
Southeast Region
| Geographic Region | Transmission Miles | Generating Capacity | Proposed NAS Miles | Proposed NAS Cost |
| Alabama, Florida, Georgia, Kentucky, Mississippi, Missouri, North Carolina, South Carolina, Tennessee, Virginia | 55,000 | 238,000 MW | 6,116 | $41,536,690,357 |
Transmission Planning and Approval Process
The electric grid in the southeastern United States is not controlled by a RTO and thus the planning and approval process is less formalized than other regions. The Florida Reliability Coordinating Council (FRCC) and the Southeastern Electric Reliability Council (SERC) are the primary bodies that oversee the bulk power system in the region. The planning process for the FRCC includes an Annual Transmission Planning Process coordinating local utility’s expansion plans into a regional development plan and a Biennial Transmission Planning Process that determines projects to make the grid more efficient.[39] The planning process for SERC involves the collaboration of many transmission providers in the region. Because planning in this region is driven by transmission providers and not a RTO, the NAS will need to gain support from the transmission providers in the region that will ultimately advocate for construction.
Recommended Financing Mechanism
Gaining support from private transmission providers will be crucial to get the NAS approved for construction, so private financing is likely to be the primary financing mechanism in this region. The estimated cost of the NAS in the southeast United States is approximately $41.5 billion. Each state in this region has legislation allowing public-private partnerships. Along with gaining support from private transmission providers, there is potential for collaboration with government entities.
Southwest and Northwest Region
| Geographic Region | Transmission Miles | Generating Capacity | Proposed NAS Miles | Proposed NAS Cost |
| Arizona, California, Colorado, Idaho, Montana, Nevada, New Mexico, Oregon, South Dakota, Utah, Washington, Wyoming | – | 125,964 MW | 10,218 | $69,396,436,656 |
Transmission Planning and Approval Process
The Western Electricity Coordinating Council (WECC) is charged with promoting the reliability of the bulk power system throughout the Western Interconnection. The territory includes the southwest and northwest regions along with California, Alberta and British Columbia. WECC represents a wide spectrum of organizations. WECC coordinates an adequacy planning process to determine transmission needs in the next 10 to 20 years. WECC studies are made available to stakeholders in the region who can then propose projects as solutions to identified needs.
Recommended Financing Mechanism
The Southwest and Northwest regions have the largest estimated cost for the NAS at approximately $69.4 billion due to covering the largest geographical area. Portions of the grid in this region will be privately financed, but government support will likely be needed for other sections due to the high cost. The Rural Utilities Service loan programs could be a viable option in this region since much of it is comprised of rural areas and the grid will improve service reliability to those regions.
Land use and siting for the NAS will be especially important in the western United States because the federal government owns so much of the land. There are likely to be greater environmental issues to clear when determining the exact grid route. Collaboration and support from the federal government will be crucial to approve segments of the grid in this region so they can attract private investment. A possible strategy is creating a structure where proceeds from the more lucrative sections of the grid in highly populated regions can help pay for less lucrative segments. This might involve bidding highly lucrative segments with less lucrative projects as a single project that would still be financially beneficial for transmission providers. This will likely be the most challenging section of the NAS to approve and finance, but it is crucial to creating the national network and allow renewable energy generated in the western United States to reach population centers in the southern and eastern regions of the country.
National overview
Private investment will be the primary funder for this project, just as private capital currently funds most energy infrastructure projects. The key to successfully financing the NAS is ensuring the project is attractive to private investors. There is private capital available in the marketplace, but that capital can only be accessed if the interests of all stakeholders are properly aligned making the NAS an attractive investment. In addition to private capital, strategic partnerships should be explored with the federal government, state and local governments, and government agencies. Due to the national security and environmental benefits, there should be government interest in this project.
Key areas of project development that will make the project more attractive to investors:
- Secure backing of federal/state governments, DOE, RTOs/ISOs: Support from the federal government and RTOs in each region will give credence to the importance of this project. This support will help increase the likelihood of getting the NAS approved and included in each RTO planning process opening the door for transmission providers to begin construction.
- Reduce permitting and regulation burden: The high regulatory environment adds to the cost and time to begin construction. This can make it challenging to secure financing at a rate acceptable to both investors and transmission providers. Legislative action can ensure that permitting for the NAS grid does not get held up by any one stakeholder. A reduced regulatory burden also reduces the overall cost of the grid.
- Ensure stakeholder interests are aligned in each region: The nation’s electric grid is a large system with a diverse set of stakeholders. Ensuring that the interests of all stakeholders are aligned will make getting approval and support for the NAS easier. Utilizing existing rights-of-way will reduce the number of local stakeholders and make gaining national support more practical. Wide spread support will help attract private investors and making financing the project feasible.
- Encourage regional and national collaboration: Historically, transmission development was completed on a state level. This has led states to have differing regulations and processes governing transmission project construction. More collaboration between states and direction from the federal government would reduce the time and cost to comply with multiple agencies in interregional transmission developments.
- Planning is crucial: Environmental studies, transmission line siting, permitting, and eminent domain are all potential hurdles for companies constructing the NAS. The proposal to use existing rights-of-way somewhat reduces this concern.
Transmission projects today are focused on increasing grid reliability and efficiency and less on load growth. Improved efficiency of electronics has stabilized the growth of energy demand across the country. Additionally, grid improvements must enable the future transmission grid to be adaptable to changes in load patterns and generation sources.
There is wide spread agreement about the need for more investment in transmission. Improved reliability will likely lower costs to rate payers due to fewer congestion charges. The NAS will allow more flexibility for RTOs to manage where electricity is generated, allowing greater access to cheaper energy. Rate payers will ultimately pay for the NAS through transmission charges, but costs for construction will likely be offset by the cheaper cost of energy and reduced congestion fees.
Cost Allocation
Cost allocation often becomes an important issue for interregional transmission projects. FERC mandates that cost allocation procedures for transmission projects must be developed by each RTO and uniformly applied. However, each RTO has slightly different procedures. In general, RTOs have shifted to a regional cost allocation system for large transmission projects. Every rate payer in the region pays for a portion because everyone benefits from a regional transmission project that improves reliability and makes the grid more efficient. Costs are generally allocated based on load usage.
If there is wide spread support for constructing the NAS, cost allocation should not create major issues. The NAS has benefits to all ratepayers so it makes sense to use a regional or even national cost allocation system. Due to the increased reliability and efficiency the NAS would create, the overall electric costs to rate payers would remain relatively constant because they will pay less congestion charges and have access to cheaper renewably generated electricity.
Conclusion
Our investigation suggests that the NAS is feasible without requiring new public funding schemes or new taxes to garner capital. Instead, rate payers will produce returns through electric bill fees. Moreover, investment in the NAS will enable the creation of millions of jobs nationwide that will not only be generated from the construction of the transmission system, but will also originate from the construction and operation of new (mostly renewable) electricity generation facilities throughout the United States. Overall, this infrastructure package will cost between $303 billion and $442 billion dollars to build the transmission system (depending on the cost of cable burial), as well as an additional $2.2 trillion dollars to construct additional electricity generation facilities. Despite these costs, the average consumer electric bill will not increase as a result. Additionally, although configuring HVDC lines underground often costs three to five times that of above ground lines, this study indicates that this costlier configuration is still an economically viable solution; an underground HVDC system (that is three times more expensive than above ground lines) will cost less than continuing the operation of the nation’s current grid system given that the cost of natural gas remains above $4.43/MMBtu. According to the EIA, the cost of natural gas is set to increase to at least $5/MMBtu by 2030, meaning that the NAS is forecasted to be a viable economic solution by its time of completion.
There is a need for new investment in our nation’s transmission infrastructure. The NAS will benefit all rate payers by allowing greater access to cheaper renewable energy while also increasing national security. The estimated $500 billion cost for an underground HVDC system will require a number of different financing mechanisms over a number of years. Private sector interest in infrastructure projects is growing and capital is available in the marketplace. The NAS must build partnerships with experienced transmission developers and gain support from federal and state governments, government agencies, and RTOs to successfully secure financing for this landmark energy transmission project.
Citations
[1]Lazard Ltd., Levelized Cost of Energy Analysis – Version 10.0, New York, NY: Lazard Ltd., December 2016
[2] “Levelized Cost and Levelized Avoided Cost of New Generation Resources in the Annual Energy Outlook 2017.” April 2017. https://www.eia.gov/outlooks/aeo/pdf/electricity_generation.pdf.
[3] Rapier, Robert. “The Long-Term Outlook For Natural Gas.” Forbes. October 31, 2016. https://www.forbes.com/sites/rrapier/2016/10/31/the-long-term-outlook-for-natural-gas/#51567e3657a4.
[4] “Guide to infrastructure financing.” Association for Financial Markets in Europe. Last Modified June 2015. http://www.ltic.org/images/AFME_Guide_to_Infrastructure_Financing_1_1.pdf
[5]Alloisio, Isabella. “Public-Private Partnerships: a focus on Energy Infrastructures and Green Investments.” International Center for Climate Governance. Last Modified April 2014. http://www.iccgov.org/wp-content/uploads/2015/05/22_Reflection__April-2014.pdf
[6] “Public-private partnerships in the US: The state of the market and the road ahead.” PricewaterhouseCoopers. Last Modified November 2016. https://www.pwc.com/us/en/capital-projects-infrastructure/publications/assets/pwc-us-public-private-partnerships.pdf
[7] Warren, Ann. “Transmission Infrastructure By Public-Private Model.” Last Modified November 6, 2009. https://www.foley.com/files/Publication/6405267f-e9fc-4fbc-abc0-d3ef34aa67d5/Presentation/PublicationAttachment/a8152aae-0a51-440b-b1dc-d40686072faf/TransmissionInfrastructurelNov2009.pdf
[8] “Financing Clean Infrastructure: Private Activity Bonds.” Center for Climate and Energy Solutions. Webinar attended July 24, 2017.
[9] Ehlers, Torsten. “Understanding the challenges for infrastructure finance.” Bank for International Settlements. Last Modified August 2014. http://www.bis.org/publ/work454.pdf
[10] “A long and winding road: The world needs more infrastructure. How will it pay for it?” The Economist. Last Modified March 22, 2014. https://www.economist.com/news/finance-and-economics/21599394-world-needs-more-infrastructure-how-will-it-pay-it-long-and-winding
[11] Tausche, Kayla. “Private investors have cash – and strict criteria – for US infrastructure projects.” CNBC. Last Modified March 31, 2017. https://www.cnbc.com/2017/03/31/private-investors-have-cash–and-strict-criteria–for-us-infrastructure-projects.html
[12] “How and when to use private money in infrastructure projects.” The Economist. Last Modified April 22, 2017. https://www.economist.com/news/finance-and-economics/21721229-public-private-partnerships-their-promise-and-their-pitfalls-how-and-when-use
[13] “State Legislation.” National Council for Public-Private Partnerships. Last Modified January 2017. http://www.ncppp.org/resources/research-information/state-legislation/
[14] Anderson, Hil. “Analysis: Path 15 an energy breakthrough?” UPI. Last Modified December 14, 2004. http://www.upi.com/Analysis-Path-15-an-energy-breakthrough/73901103074353/
[15] “2018 Budget: Infrastructure Initiative.” White House Press Release. Accessed July 2017. https://www.whitehouse.gov/sites/whitehouse.gov/files/omb/budget/fy2018/fact_sheets/2018%20Budget%20Fact%20Sheet_Infrastructure%20Initiative.pdf
[16] “Loan Guarantee Solicitation Announcement.” U.S. Department of Energy Loan Programs Office. Last Modified March 2, 2016. https://energy.gov/sites/prod/files/2015/12/f27/DOE-LPO_REEE_Solicitation_03-Jun-2014.pdf
[17] “One Nevada Line.” U.S. Department of Energy. Accessed July 2017. https://energy.gov/lpo/one-nevada-line
[18] Milford, Lewis; Muro, Mark; Morey, Jessica; Saha, Devashree; Sinclair, Mark. “Leveraging State Clean Energy Funds for Economic Development.” Brookings-Rockefeller Project on State and Metropolitan Innovation. Last Modified January 2012. https://www.brookings.edu/wp-content/uploads/2016/06/0111_states_energy_funds.pdf
[19] “Electric Programs.” United States Department of Agriculture Rural Development. Accessed July 2017. https://www.rd.usda.gov/programs-services/all-programs/electric-programs
[20] Trabish, Herman K. “The Rural Utilities Service: How the USDA is building a clean energy future for rural America.” Last Modified June 10, 2016. http://www.utilitydive.com/news/the-rural-utilities-service-how-the-usda-is-building-a-clean-energy-future/420334/
[21] “Financing Clean Infrastructure: Private Activity Bonds.” Center for Climate and Energy Solutions. Webinar attended July 24, 2017.
[22] “Electric Power Markets: National Overview.” Federal Energy Regulatory Commission. Accessed July 2017. https://www.ferc.gov/market-oversight/mkt-electric/overview.asp
[23] “Transmission Planning Process Guide.” ISO New England. Last Modified April 6, 2017. https://www.iso-ne.com/static-assets/documents/2017/04/transmission_planning_process_guide_4_6_2017.pdf
[24] Fan, Dawei. “NYISO Planning Update.” ISO New York. Last Modified December 9, 2016. https://www.iso-ne.com/static-assets/documents/2016/12/2016-12-09_ipsac_nyiso_planning_update_a03.pdf
[25] “Response to Request for Information: New York Energy Highway.” West Point Transmission. Last Modified May 30, 2012. http://www.nyenergyhighway.com/Content/documents/9.pdf
[26] “PJM Regional Transmission Expansion Plan 2016.” PJM. Last Modified February 28, 2017. http://www.pjm.com/-/media/library/reports-notices/2016-rtep/2016-rtep-book-1.ashx?la=en
[27] Bresswein, Kurt. “Susquehanna-Roseland power line, a $1.4 billion project, switched on.” LehighValleyLive. Last Modified May 13, 2015. http://www.lehighvalleylive.com/breaking-news/index.ssf/2015/05/susquehanna-roseland_power_lin_4.html
[28] “Corporate Information.” MISO. Last Modified March 2017. https://www.misoenergy.org/Library/Repository/Communication%20Material/Corporate/Corporate%20Fact%20Sheet.pdf
[29] “MISO Transmission Expansion Plan.” MISO. Accessed July 2017. https://www.misoenergy.org/Library/Repository/Study/MTEP/MTEP16/MTEP16%20Full%20Report.pdf
[30] CapX2020. Accessed July 2017. http://www.capx2020.com/
[31] Shaffer, David. “Minnesota utilities flip switch on large segment of $2.1 billion CapX2020 transmission project.” StarTribune. Last Modified May 4, 2015. http://www.startribune.com/minnesota-utilities-flip-switch-on-large-segment-of-2-1-billion-capx2020-transmission-project/302495011/
[32] “2013 Integrated Transmission Plan 20-Year Assessment Report.” Southwest Power Pool. Last Modified July 30, 2013. https://www.spp.org/documents/20438/20130730_2013_itp20_report_clean.pdf
[33] Midwest Transmission Project. Accessed July 2017. http://www.midwesttransmissionproject.com/Default.htm
[34] “Today’s Outlook.” California ISO. Accessed July 2017. http://www.caiso.com/outlook.html
[35] “2016-2017 Transmission Plan.” California ISO. Last Modified March 17, 2017. http://www.caiso.com/Documents/Board-Approved_2016-2017TransmissionPlan.pdf
[36] “Renewable Energy – Overview.” California Energy Commission. Last Modified December 22, 2016. http://www.energy.ca.gov/renewables/tracking_progress/documents/renewable.pdf
[37] “Current Planning Guide.” ERCOT. Accessed July 2017. http://www.ercot.com/mktrules/guides/planning/current
[38]“The Competitive Renewable Energy Zones Process.” ERCOT. Last Modified August 11, 2014. https://energy.gov/sites/prod/files/2014/08/f18/c_lasher_qer_santafe_presentation.pdf
[39] “FRCC Regional Transmission Planning Process.” Florida Reliability Coordinating Council. Last Modified October 30, 2015. https://www.frcc.com/Planning/Shared%20Documents/Regional%20Transmission%20Planning%20Process/FRCC-MS-PL-018_FRCC_Regional_Transmission_Planning_Process.pdf